Post
Salesforce “How To” ABCs: B
Posted on January 25, 2019 (Last modified on January 16, 2026) • 7 min read • 1,333 wordsHow to Build a Report.

We know how it is. You can do so much with Salesforce that sometimes all the awesome new tips and tricks you’re picking up push something else right back out of your brain. You flip through your implementation and training notes, double check the documentation, try to track down that trailhead you remember doing — and then ultimately turn to Google.
In the Salesforce “how to” ABCs series, we run through the most-commonly searched questions to help you (and the rest of us) find those answers fast. Today we’ll tackle the letter ‘B’: How to Build a Report! Let’s get started!

Today, we’ll be walking through building an opportunity report, but the technique will be the same whether you need to report on leads, accounts, activities, or anything else!
We’ll also assume that you already have the necessary permissions to create custom reports. If not, just reach out to your admin and let them know you’d like to get started diving into the data for yourself!
Building a Report
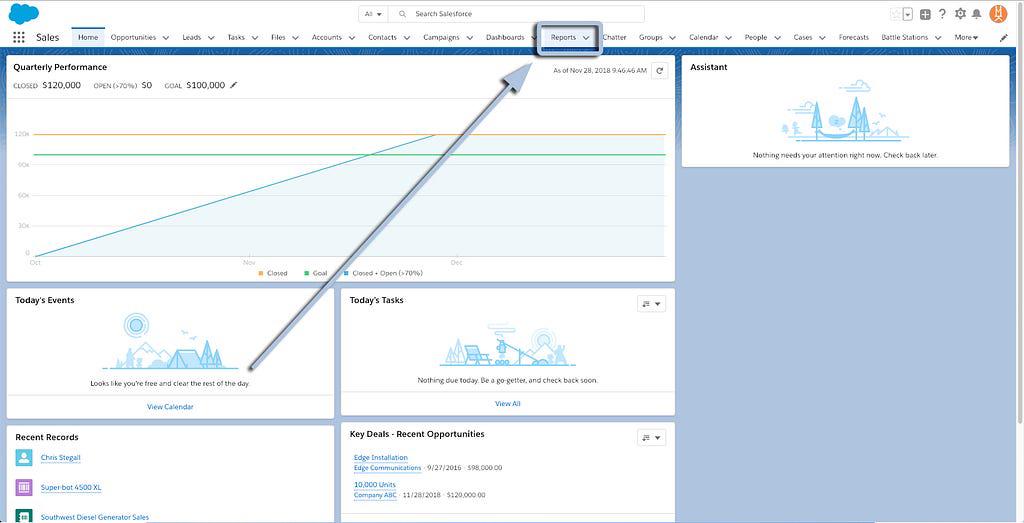
First up, navigate to the Reports tab.
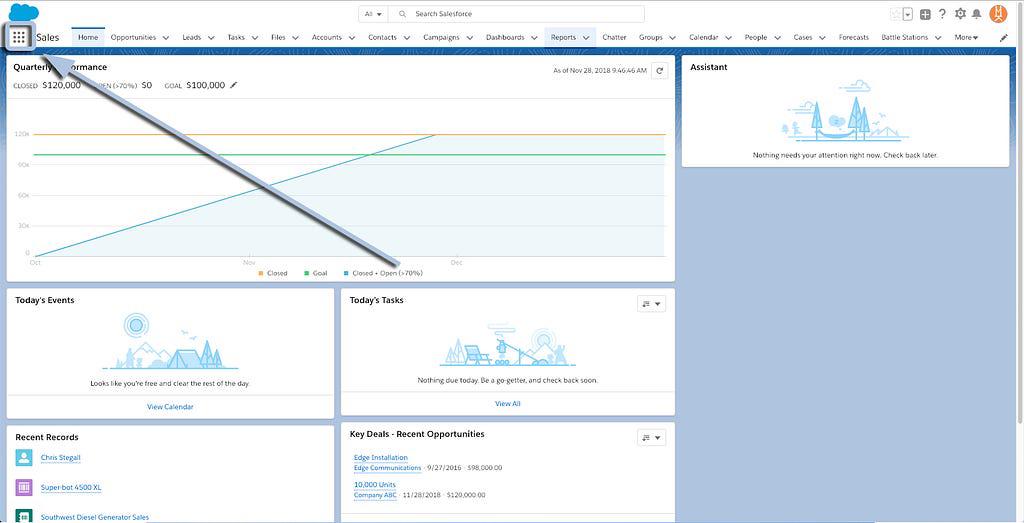
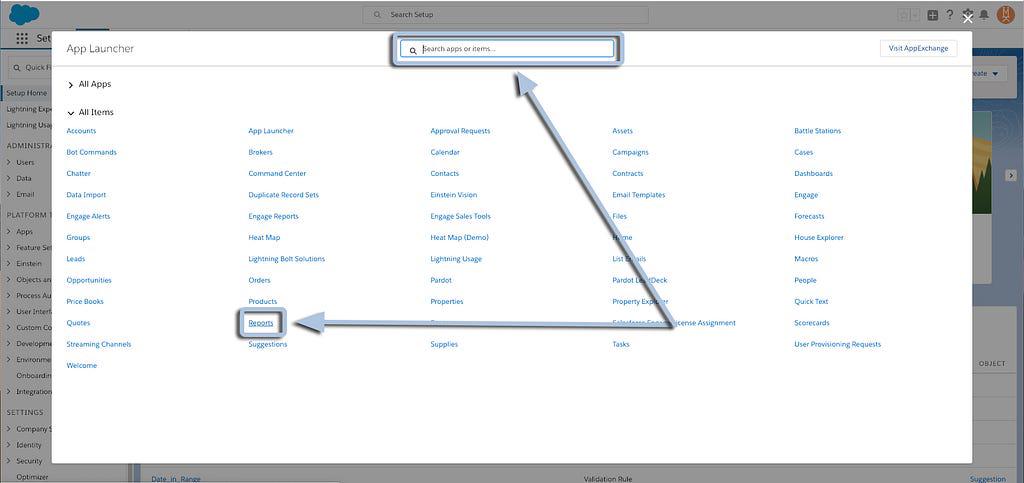
If you don’t have a Reports tab, you can find Reports in the App Launcher by clicking the launcher’s 3x3 tile in the top left, and then scrolling down to “Reports” (or typing it into the search bar).
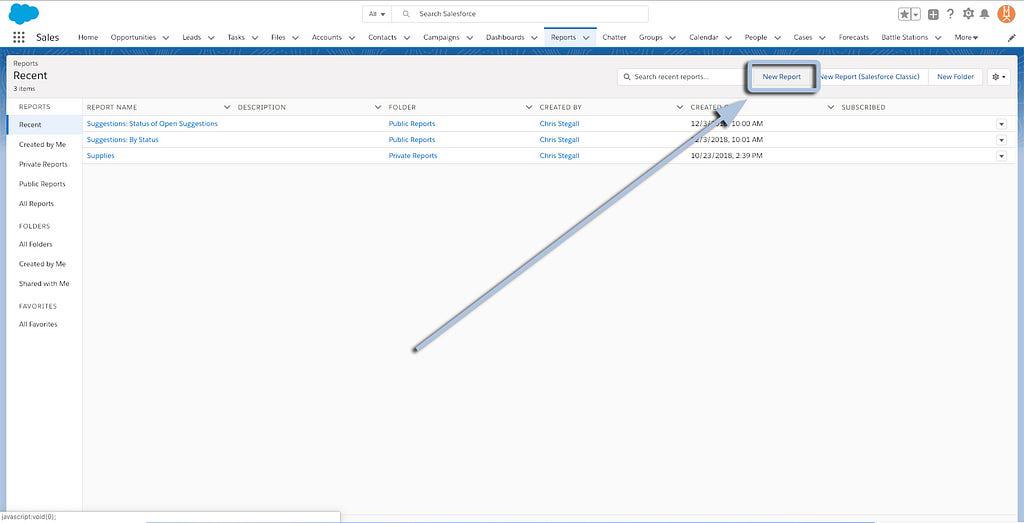
That’ll land you on your reports page. Now, click “New Report” in the top right.
That will pop open the “Choose Report Type” window. Simply enter your desired report type in the search bar and select it — in this case we’ll search and select “Opportunities”.
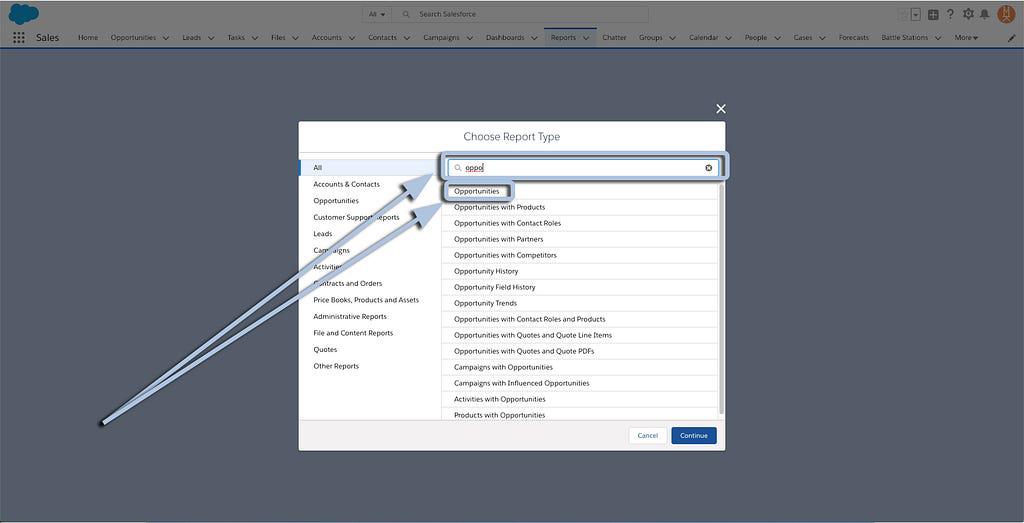
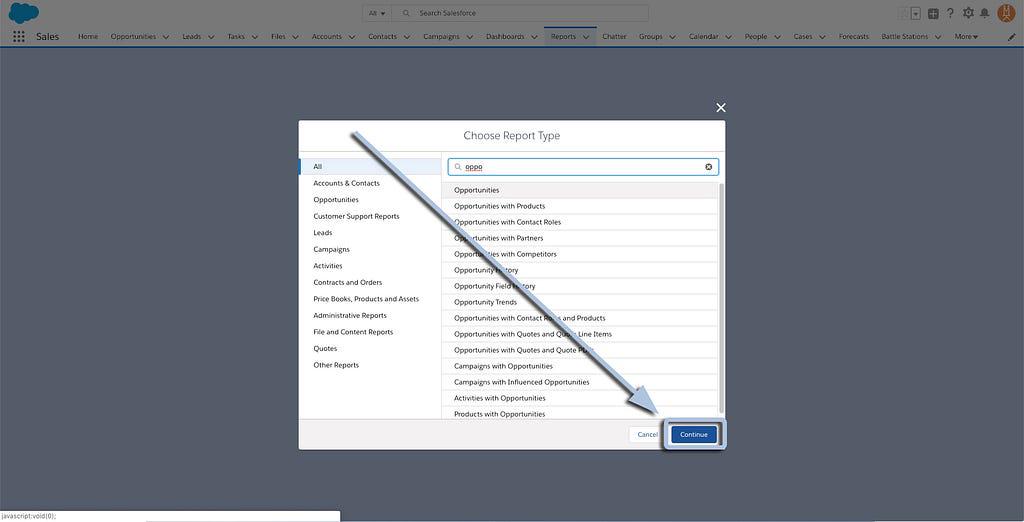
Once your desired report type is highlighted, click “Continue” at the bottom of the window.
That will open up your report editing page, and you’re ready to start building!
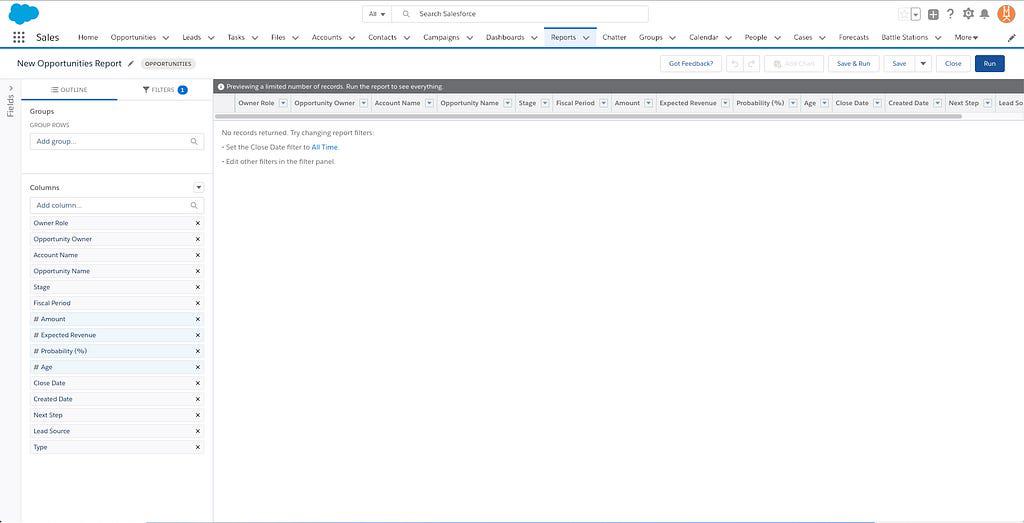
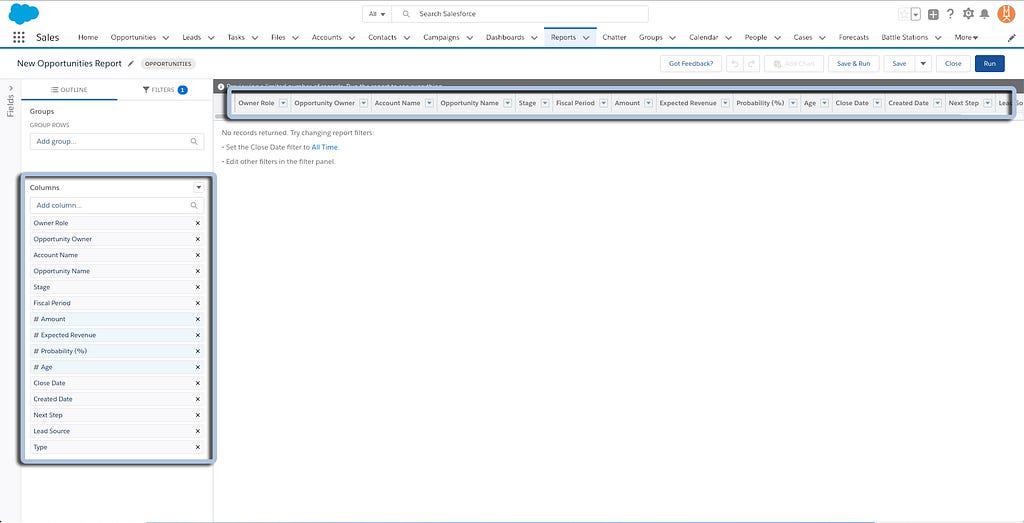
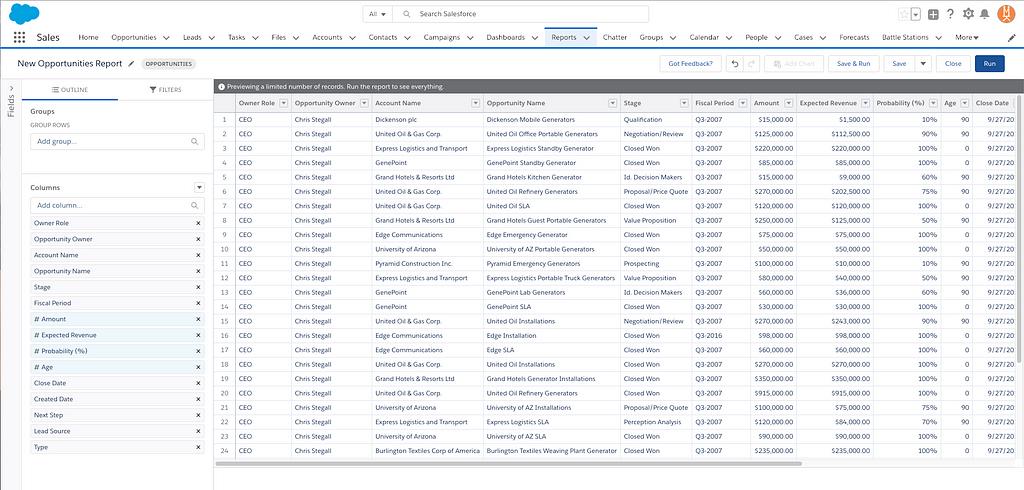
To begin, let’s run through a few of the key components on this page. Front and center you’ll see a preview of your report.
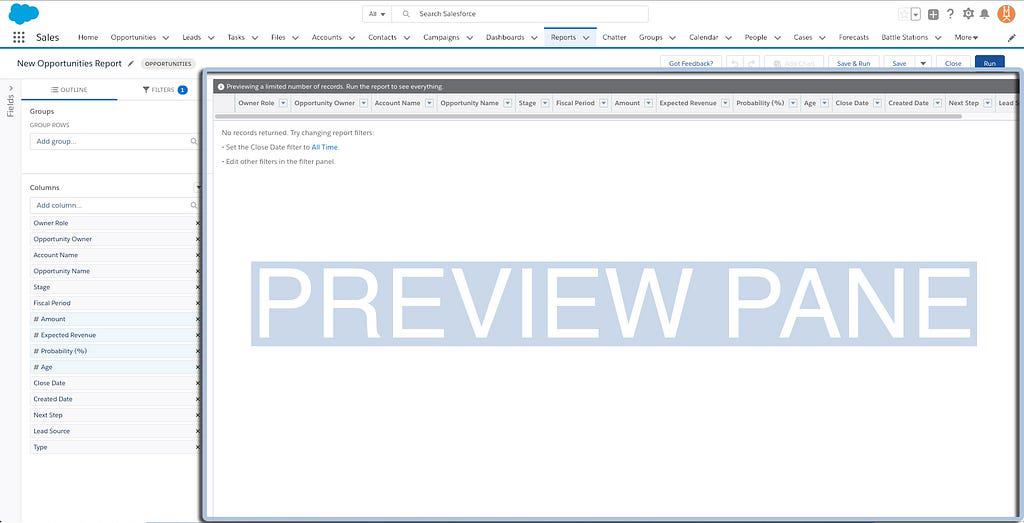
The preview won’t run through all of your data, so if you’re just looking for a quick summary or something, don’t stop here. The preview pane exists so you can be sure the final report will look and behave as desired, but you’ll need to actually run the report to get the full picture. Don’t worry, we’ll get there.
Along the top of the preview pane you’ll see your report’s columns and you’ll notice they correspond to the list of “Columns” on the left hand side of the page.
Above your columns on the left, you’ll see your “Groups” listed. This is where we’ll be able to add specific groupings and summaries to our report.
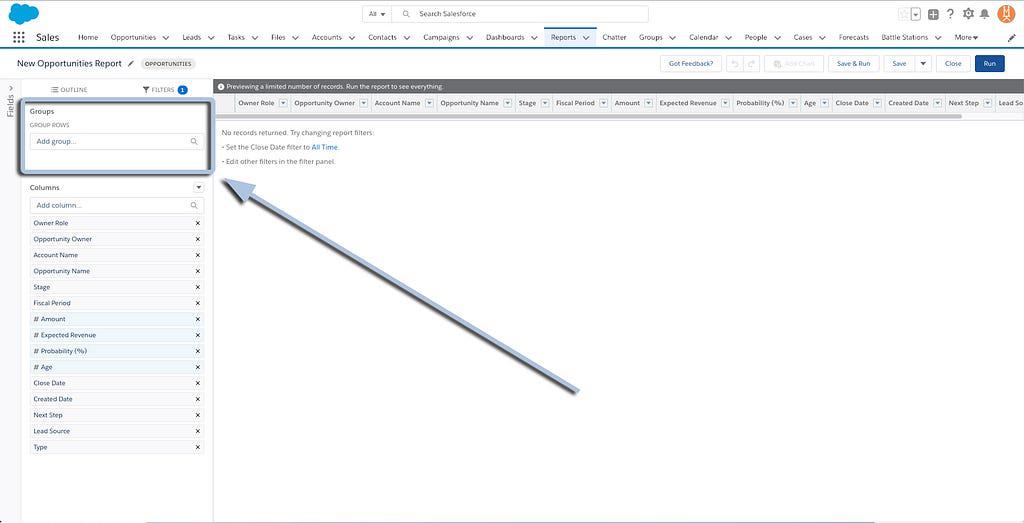
Lastly, above “Groups” you’ll see the tabs to switch between the Outline view (where we are currently), and the Filter view (where you’ll be able to limit which data is pulled into the report).
Filters
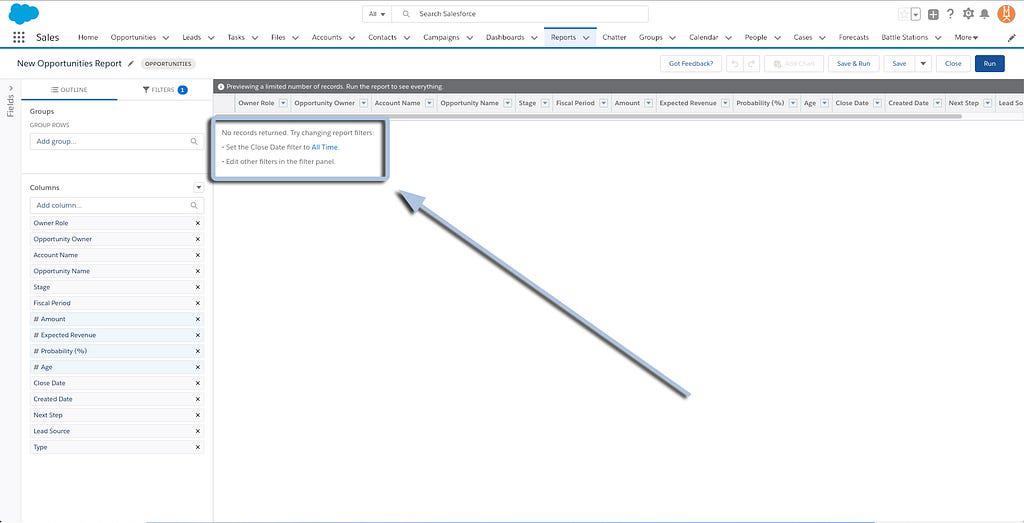
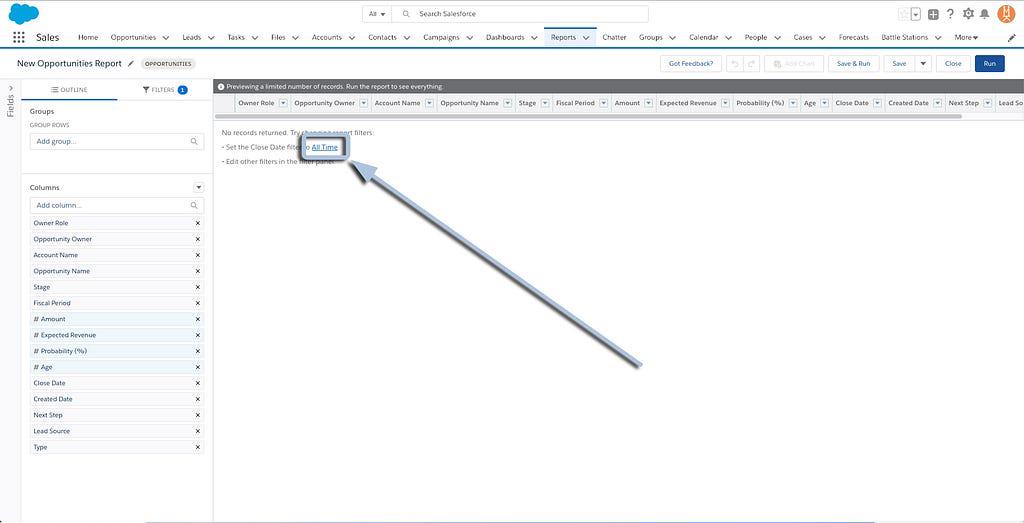
And by now you’ve likely noticed that our preview pane is pretty empty. Luckily, Salesforce makes it clear why:
No records returned. Try changing report filters: Set the Close Date filter to All Time. Edit other filters in the filter panel.
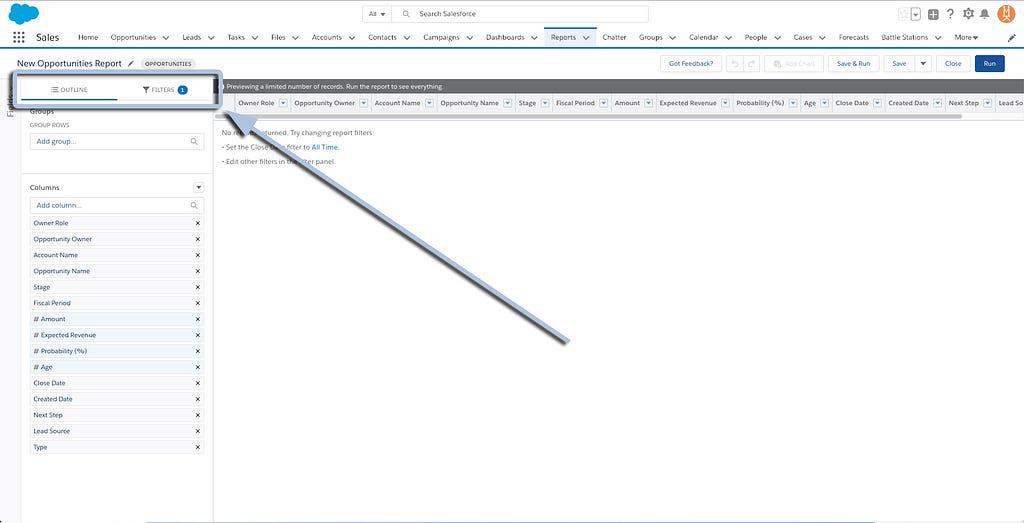
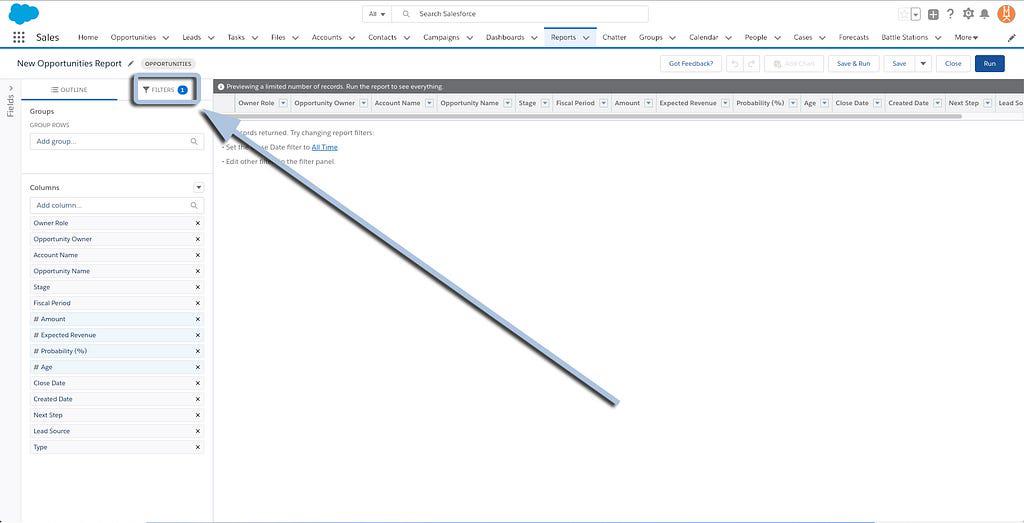
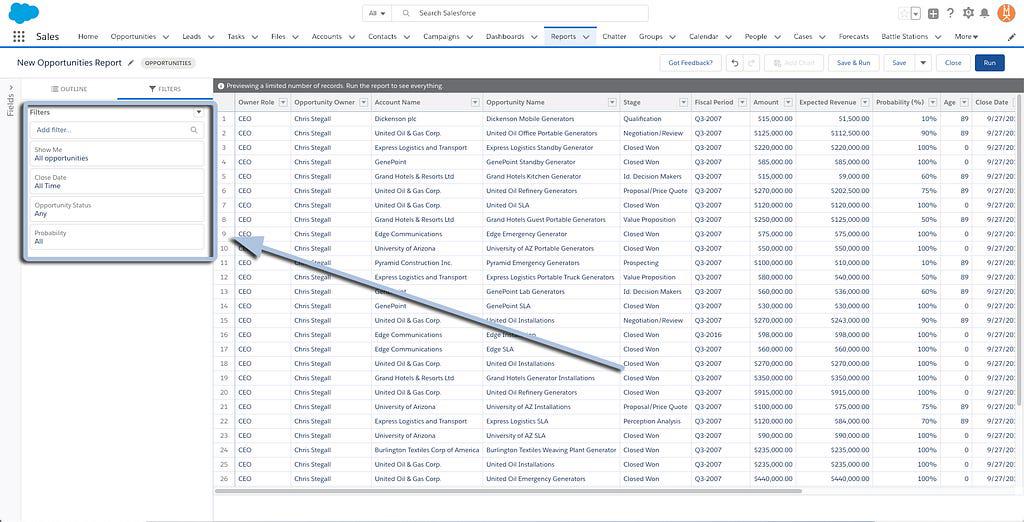
There’s a filter limiting the data our report is pulling in. To eliminate the filter, either click “All Time”…
… or click on the “Filters” tab.
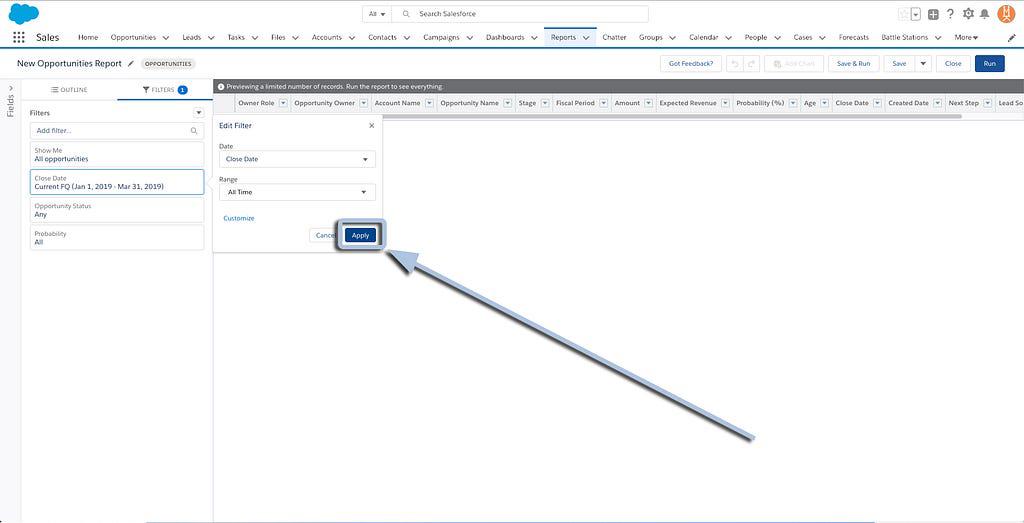
Then change the “Close Date” filter from “Current FQ” to “All Time”.
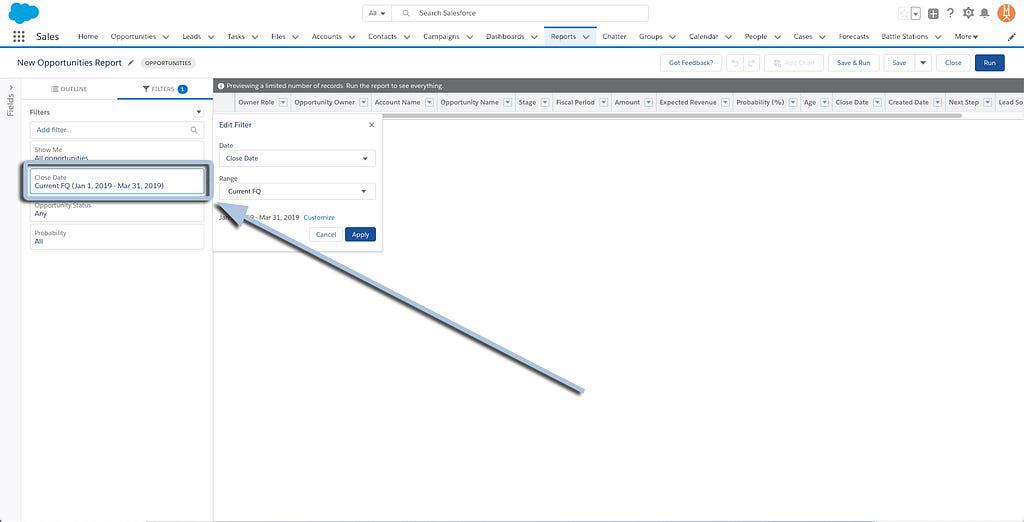
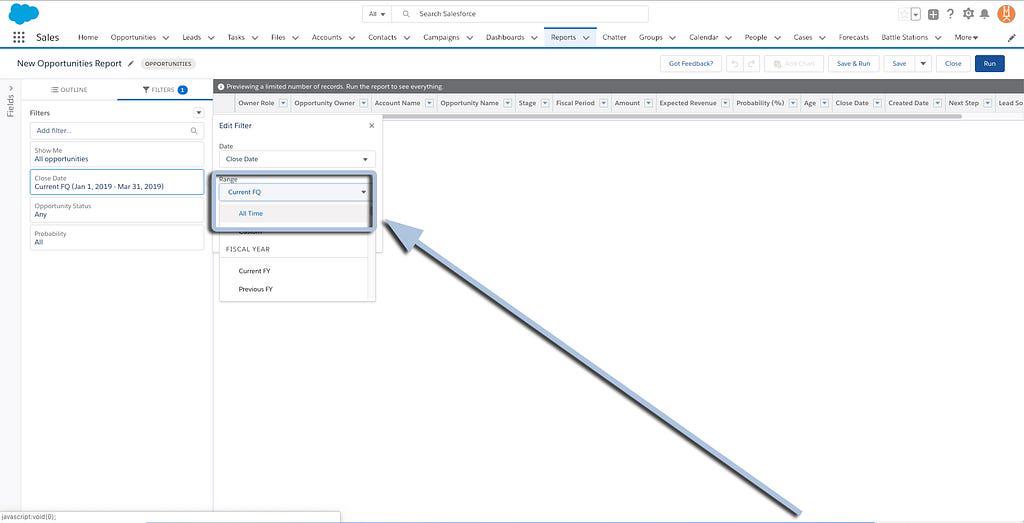
Then click “Apply”.
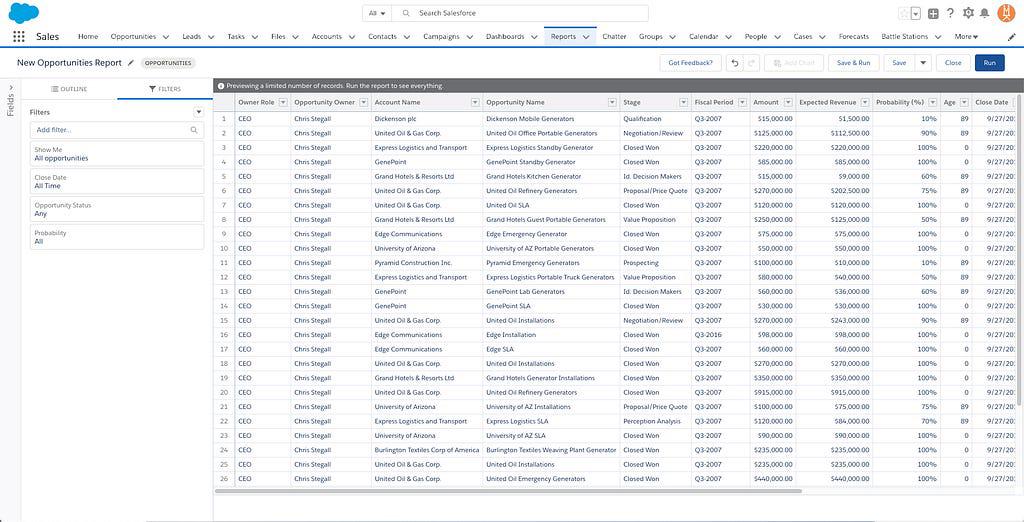
And now our report preview is showing us data!
If you’d like to add a filter, simply type the field you’d like to filter by in the search box, enter the criteria (like we just did for “Close Date” above) and apply it.
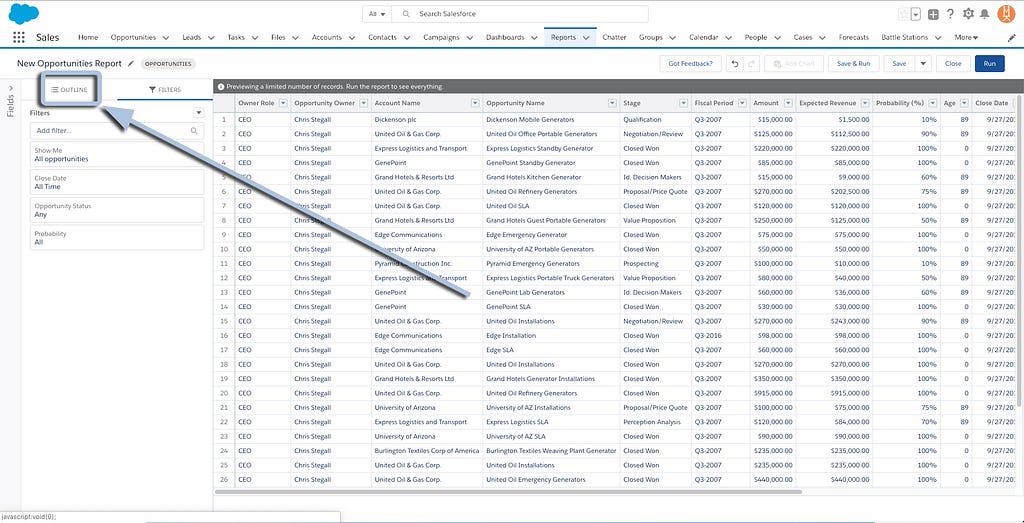
With your filters in place, let’s get back to configuring the report. Navigate back to the Outline tab by clicking “Outline” in the top left.
Columns
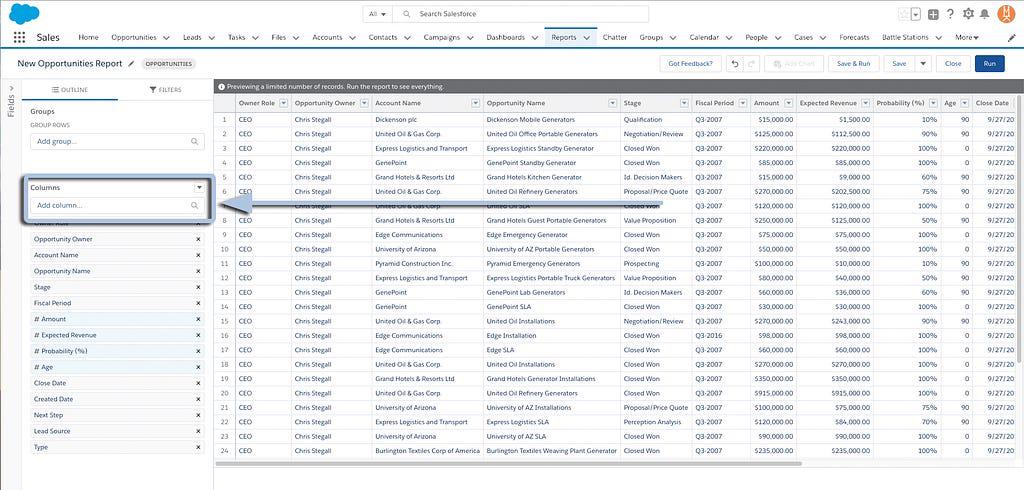
Adding, removing, and reorganizing your report’s columns is simple, thanks to the Columns panel on the left of the preview pane. To add a column, simply click into the “Add Column” text field, and type away!
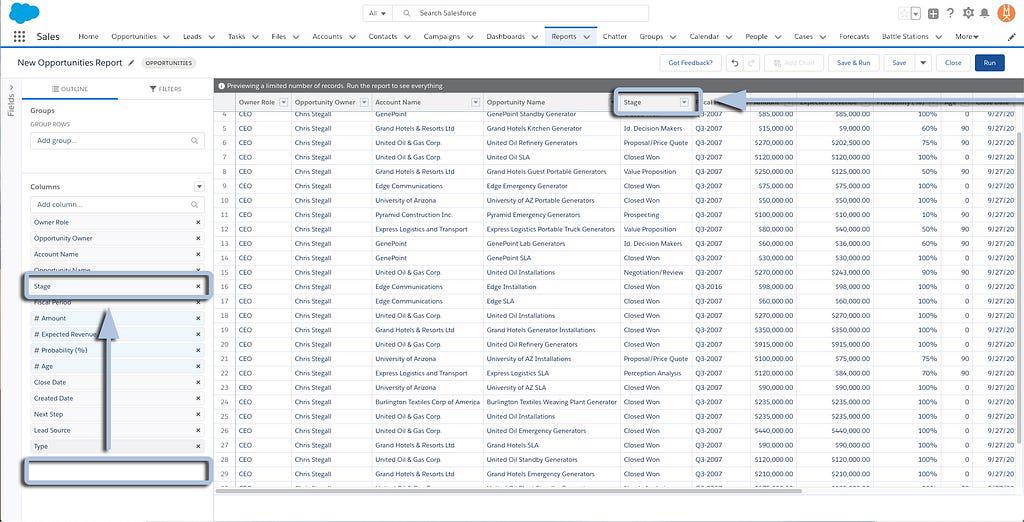
For this example, let’s add a column for Stage so we can see how far along the sales process each of these Opportunities is. Type “Stage” into the text field and select it from the list that pops down.
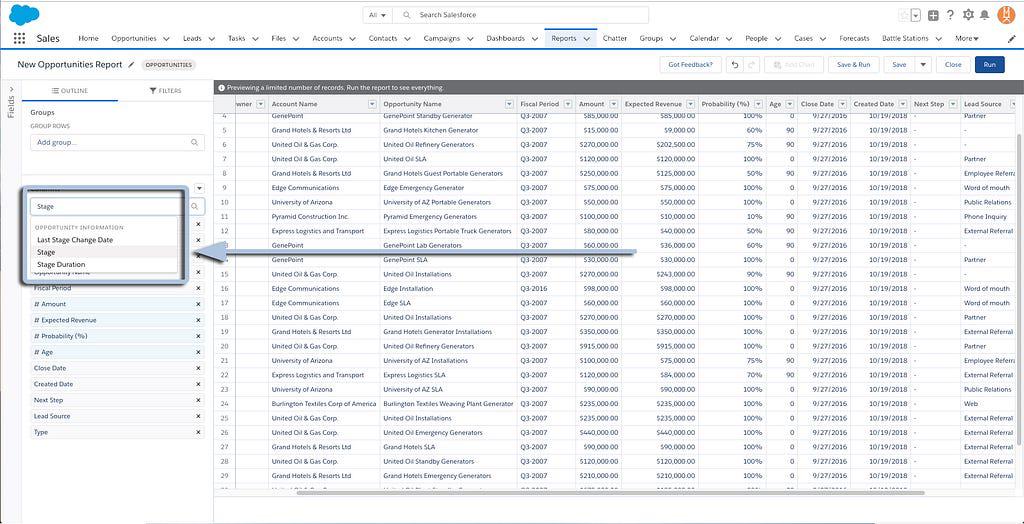
And now you’ll see Stage added both to the Columns list on the left, and at the far right of your report preview!
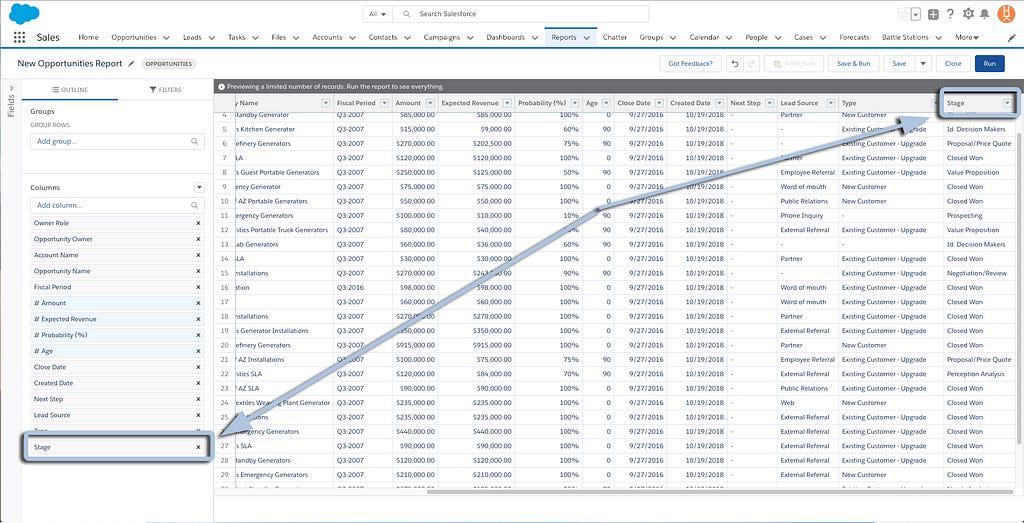
To rearrange your columns, just click and drag them up or down the list on the left. We’ll drag “Stage” up so it appears just below Opportunity Name, and you’ll notice it adjusts in the preview pane accordingly!
And if you’d like to remove columns, simply click the ‘x’ next to the field’s name in the list.
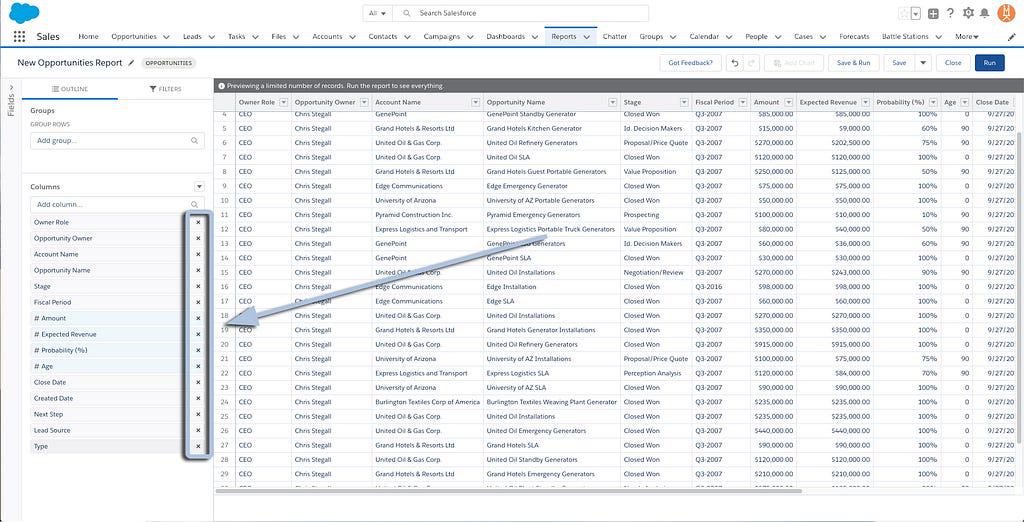
Let’s remove “Created Date” for this example, so click the “x” next to “Created Date”.
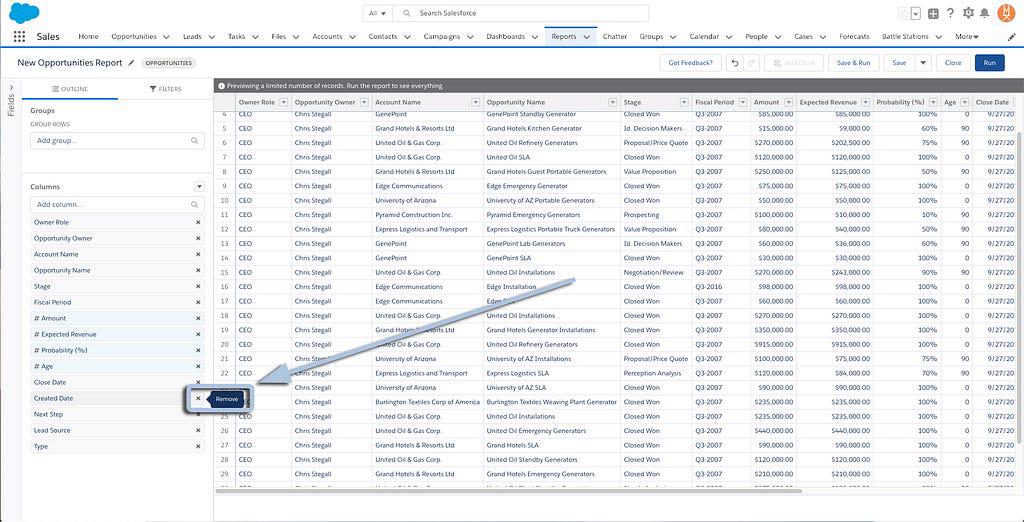
Aaaaand it’s gone!
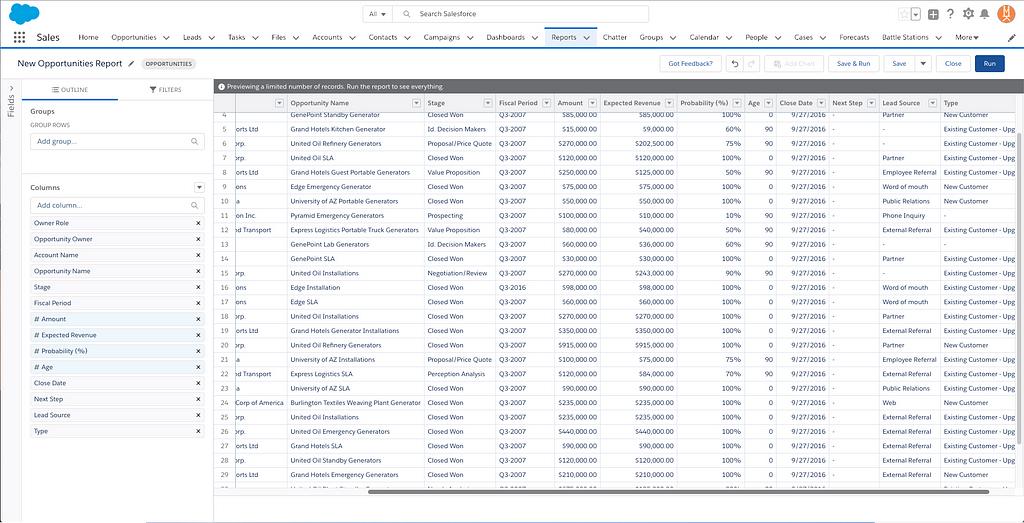
Add, remove, and rearrange your fields until you’re satisfied and we’ll move on to grouping!
Groups
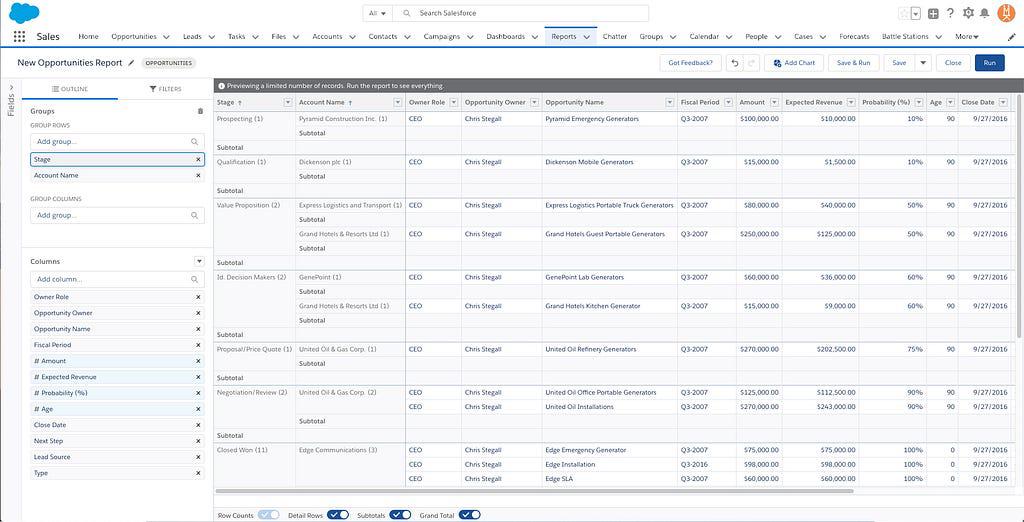
Groups work similarly to columns, but they’ll help dictate the order of your rows and give you summaries of the number of records in each grouping. To add a group, just like with the columns, click into the “Add Group” text field, and type away!
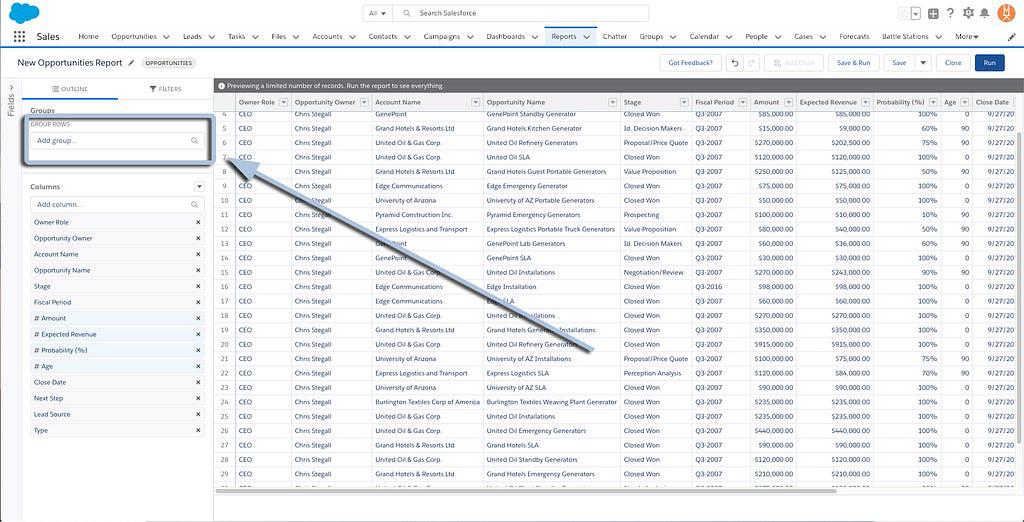
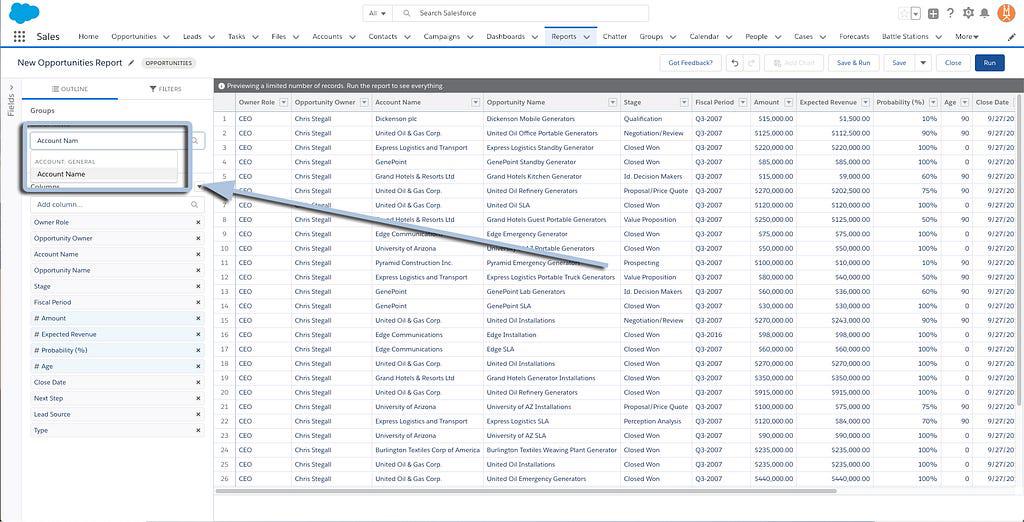
Let’s say we want to group these opportunities by the accounts they belong to, so we type and select “Account Name” in the groups’ text box.
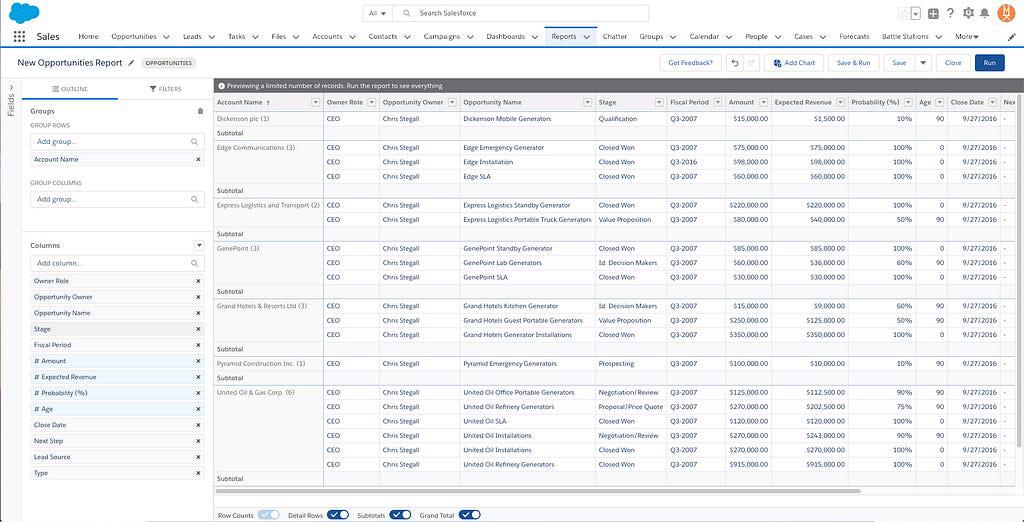
And now your report preview will show the opportunities, grouped by their accounts!
You can add additional groups to further organize your data and, if you decide one of your columns would make a better group, you can simply drag it up from the columns list to the groups list! We’ll drag “Stage” up from columns to groups so we can organize our opportunities both by account, and by their stage of the sales process.
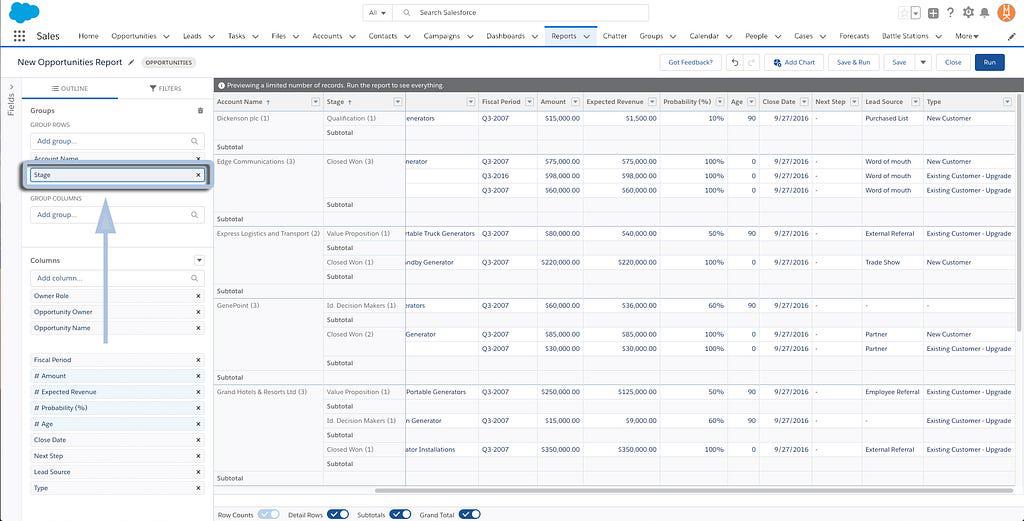
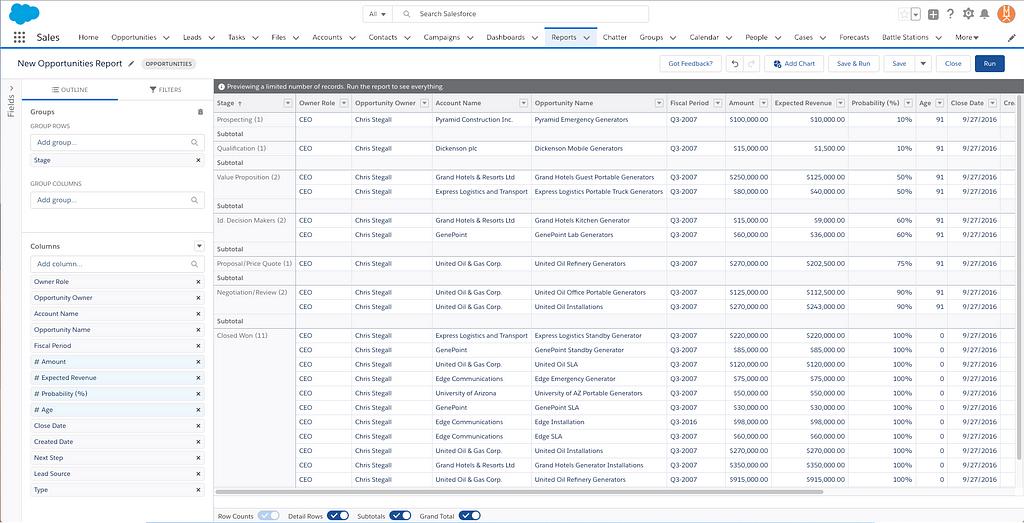
You’ll now see the data grouped by account, then opportunity stage! And if you’d rather see it grouped by stage, and then account, rearranging groups is the same as rearranging columns. Just drag the fields on the left up and down until you’ve got everything in the order you’d like. If we swap Stage and Account Name, you’ll see the preview pane update accordingly.
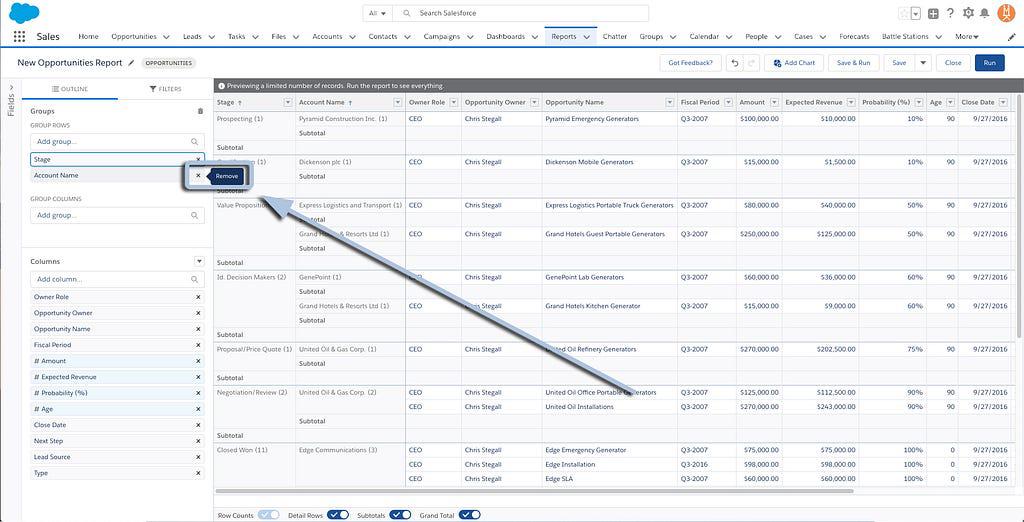
Removing groupings works identically to columns as well. Simply click the “x” next to the group you’d like to eliminate (or drag it back down to columns if you’d still like it somewhere in the report).
And once you’ve got your columns, groups, and filters set — it’s time to run the report!
Running (and Saving) Your Report
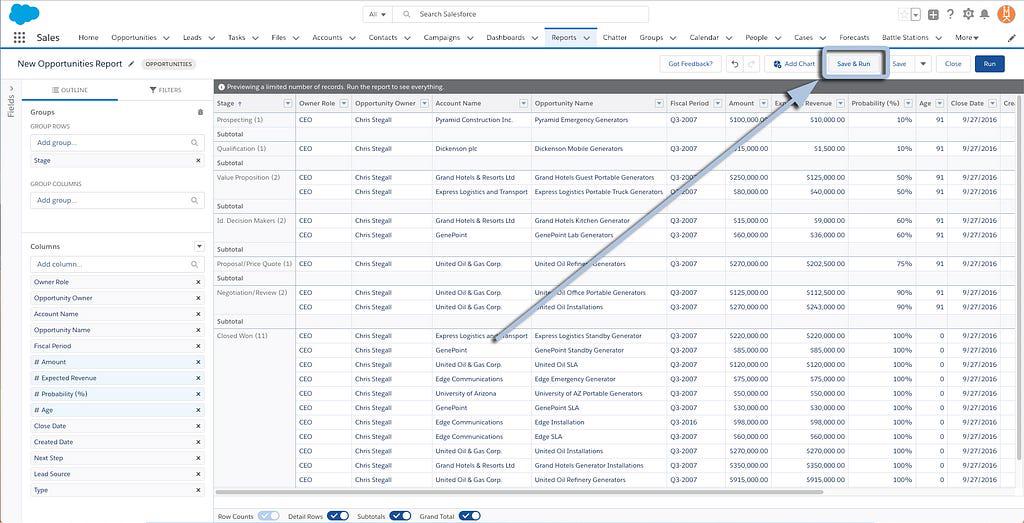
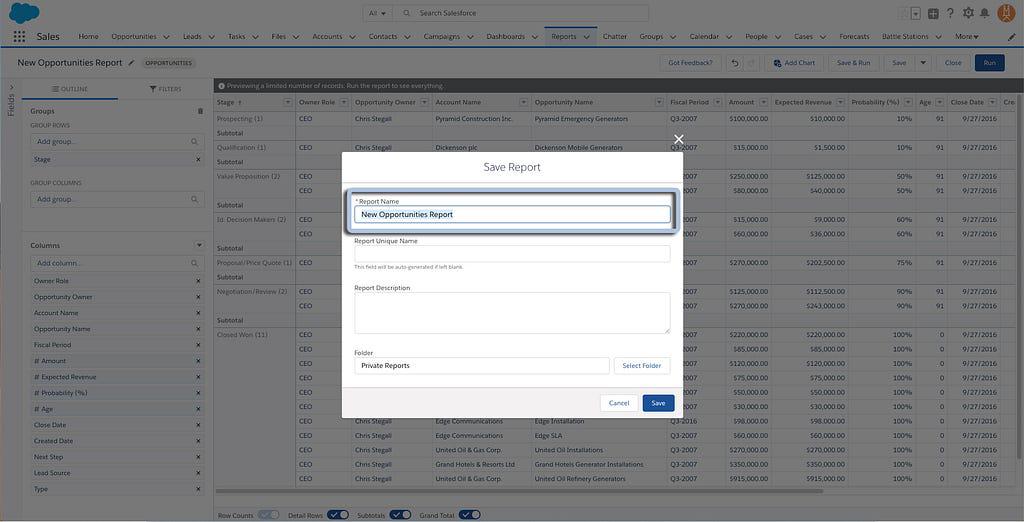
We’re in the home stretch! In the top right, above the preview pane, click “Save and “Run”. (Or if this is a one-off report and you’d rather not save, instead click the button that just says “Run” on the far right.)
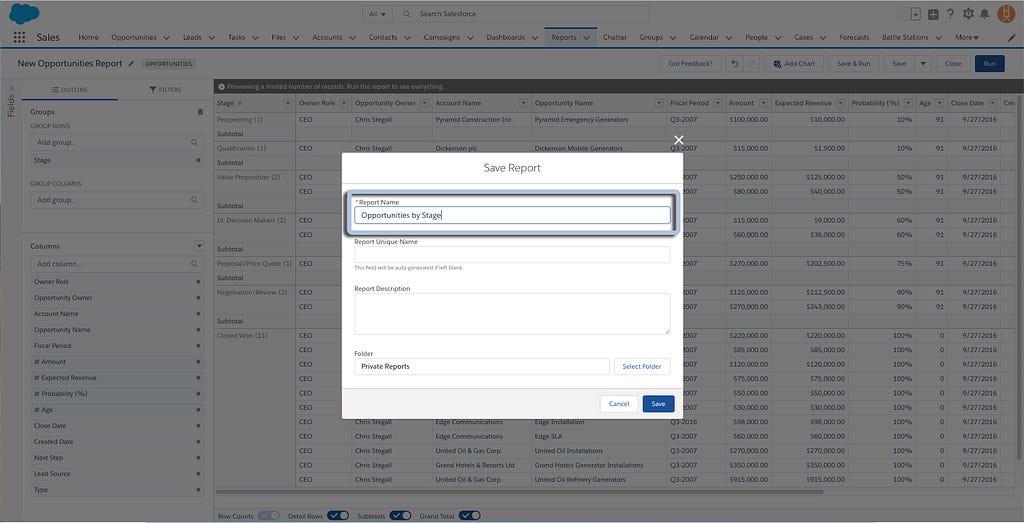
Clicking “Save and Run” will open the “Save Report” pop-out. Give your new report an appropriate name.
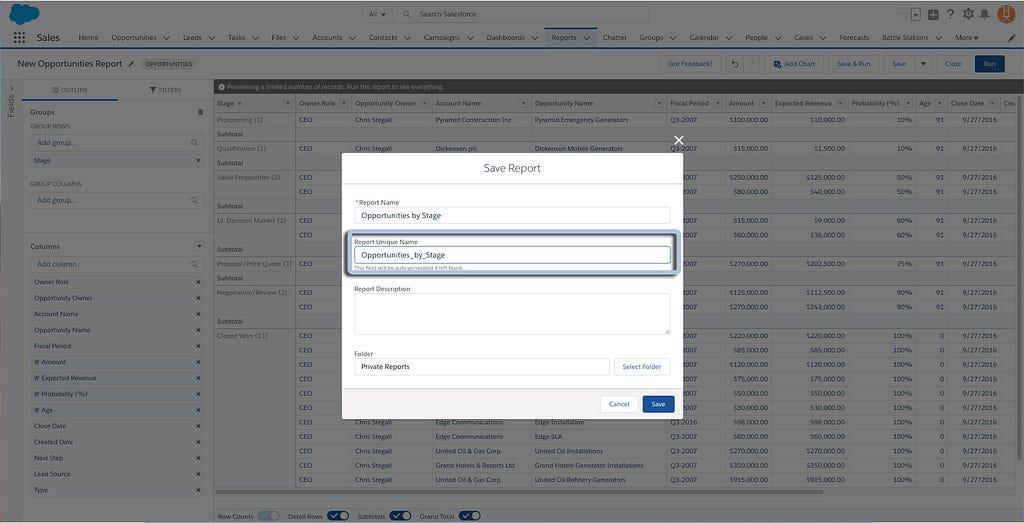
Then “tab” or click down to the “Report Unique Name” field. It’ll auto-populate, but feel free to tweak it to something easy to reference.
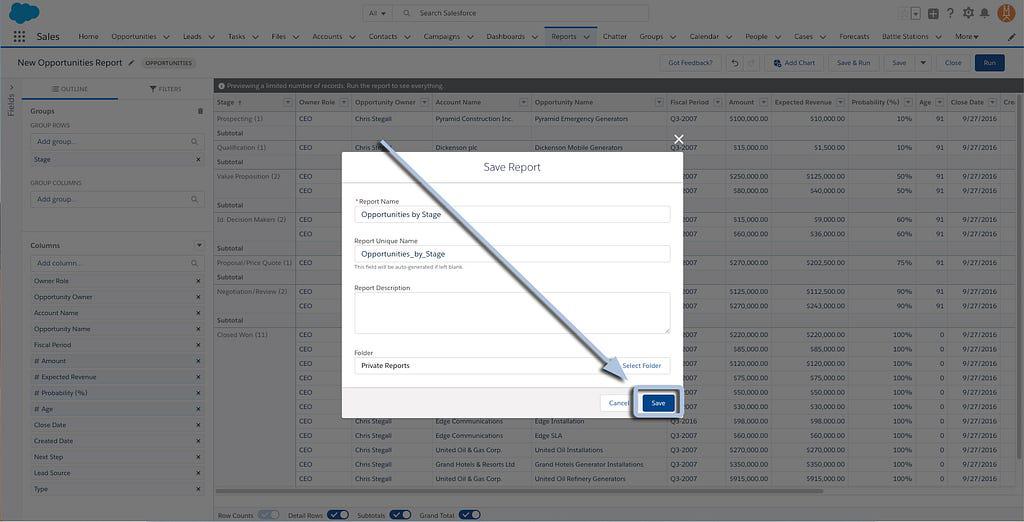
Add a little description of your report if you’d like to help make it easier on yourself in the future. Choose the folder you’d like to save your report in (it will default to your Private Reports folder). And then click “Save”.
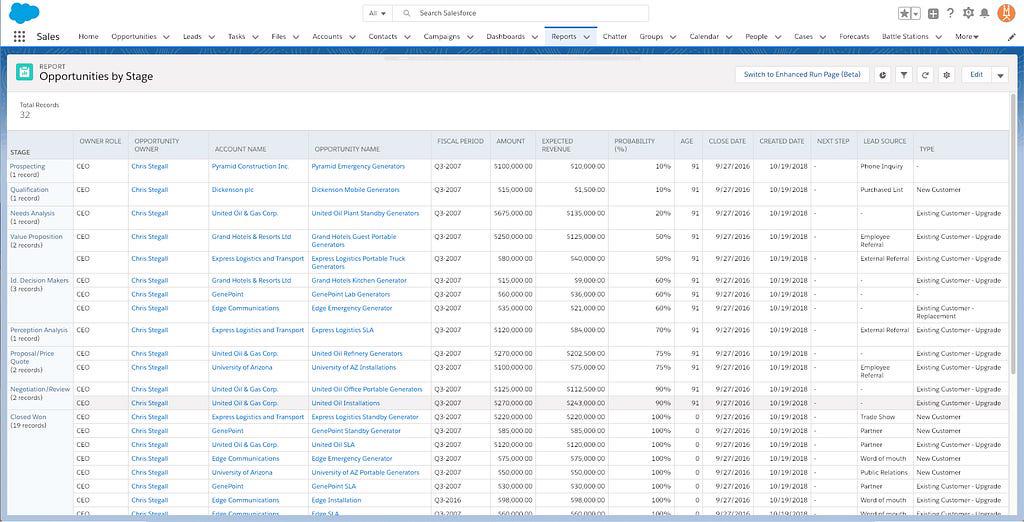
Voila! You’ll now see your report, populated by all of your data, and configured just the way you want it!
Congratulations! Now you’re reporting like a pro! You can use the same process to create reports about anything you’d like (and have permissions to access). Accounts, Leads, Campaigns — the world, and your data, is your oyster! Thanks for following along and if you have any questions or comments, drop them in the responses below. And if you need more help getting your org set-up, or want some guidance crafting your overall Salesforce strategy, give us a call — we’re always happy to help! In our next look at the Salesforce “How To” ABCs, we’ll tackle the letter ‘C’. Until then, work smart, hard, and happy! And we’ll see you in the cloud.